
Century 21 People’s Choice Realty Inc., Brokerage
120 MATHESON BLVD E #103
MISSISSAUGA, Ontario
L4Z 1X1


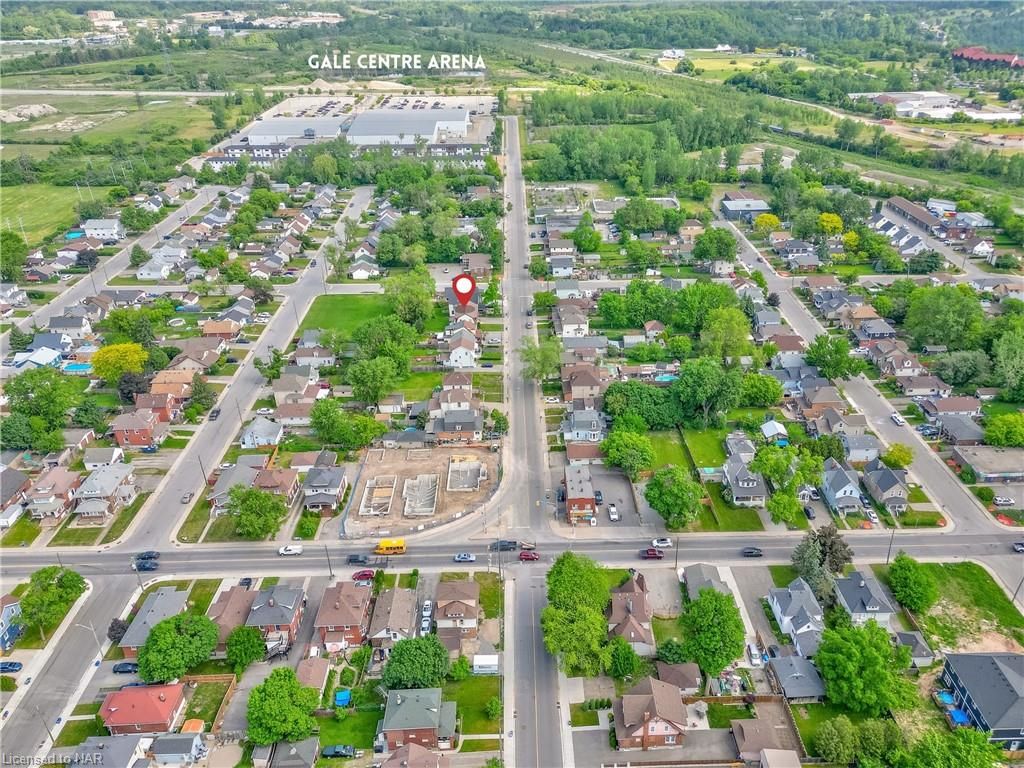
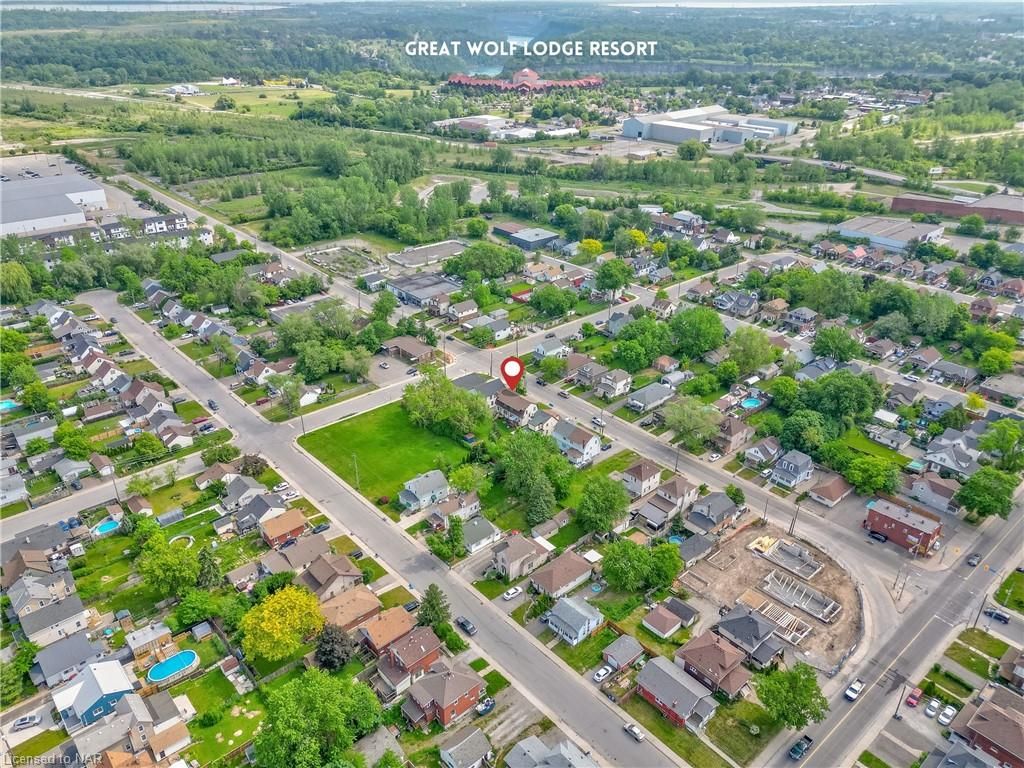
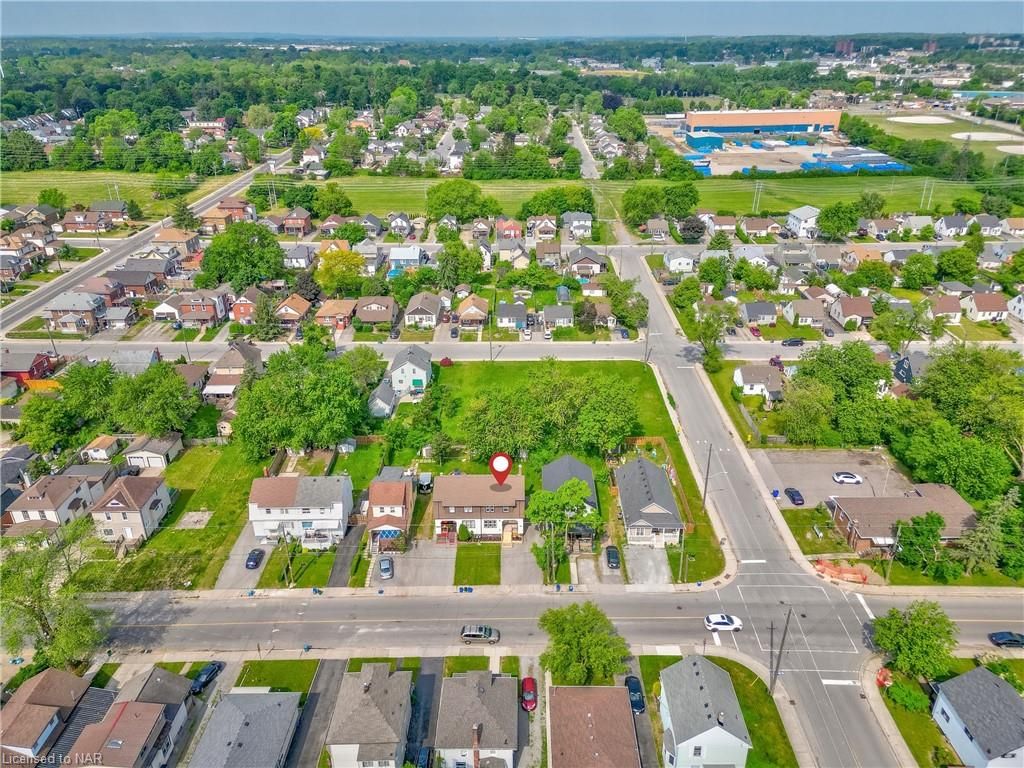

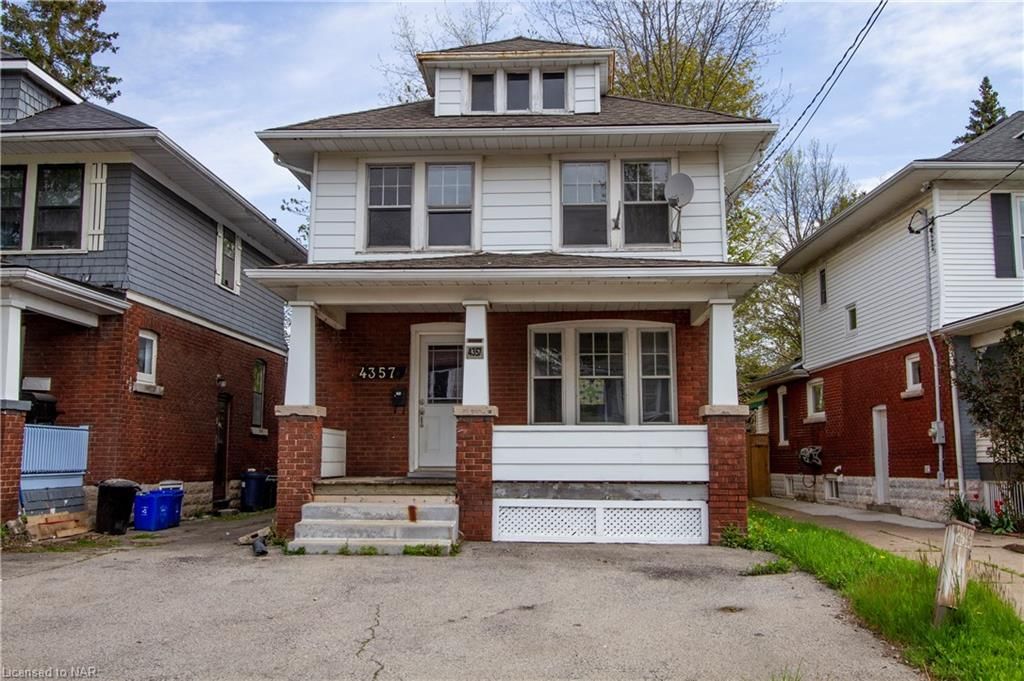
Niagara Falls, Downtown, L2E 4N4
$448,888$000000
Listed by ROYAL LEPAGE NRC REALTY.
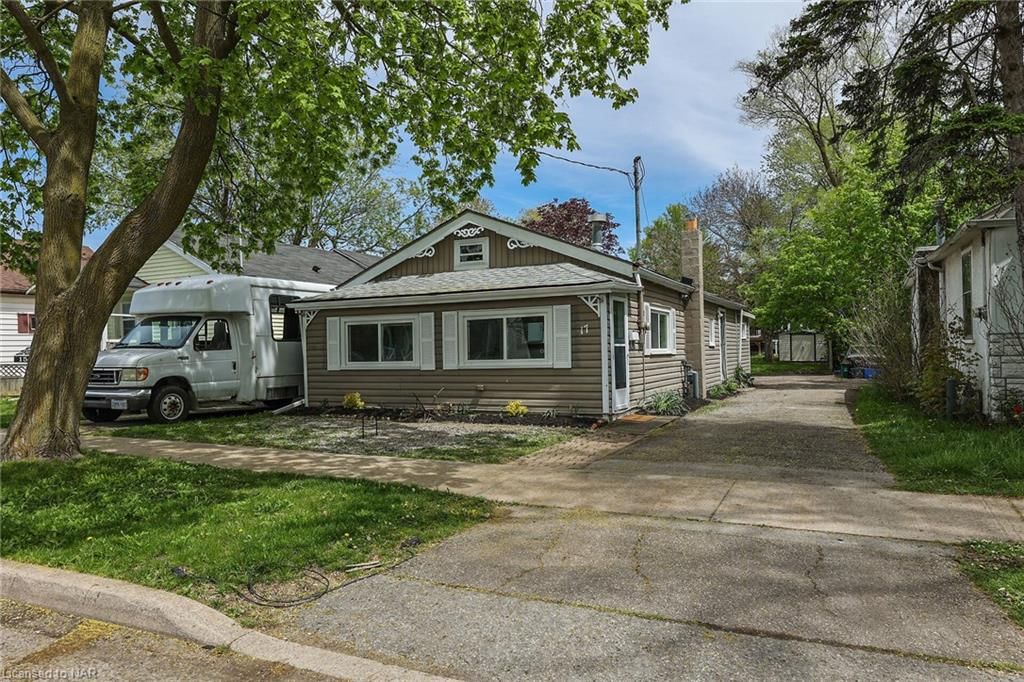
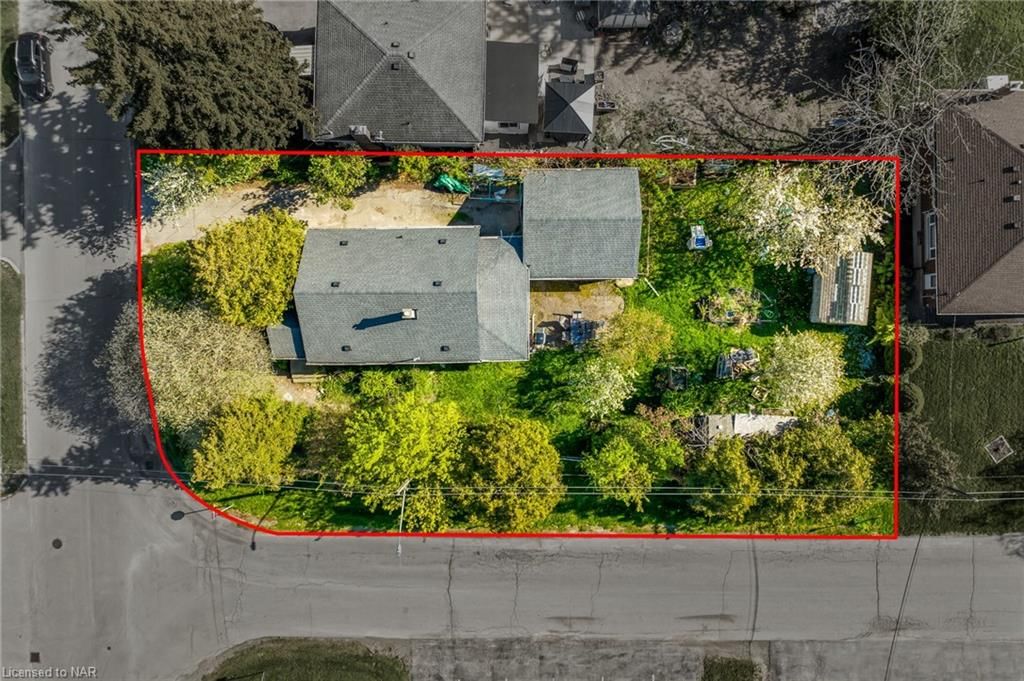
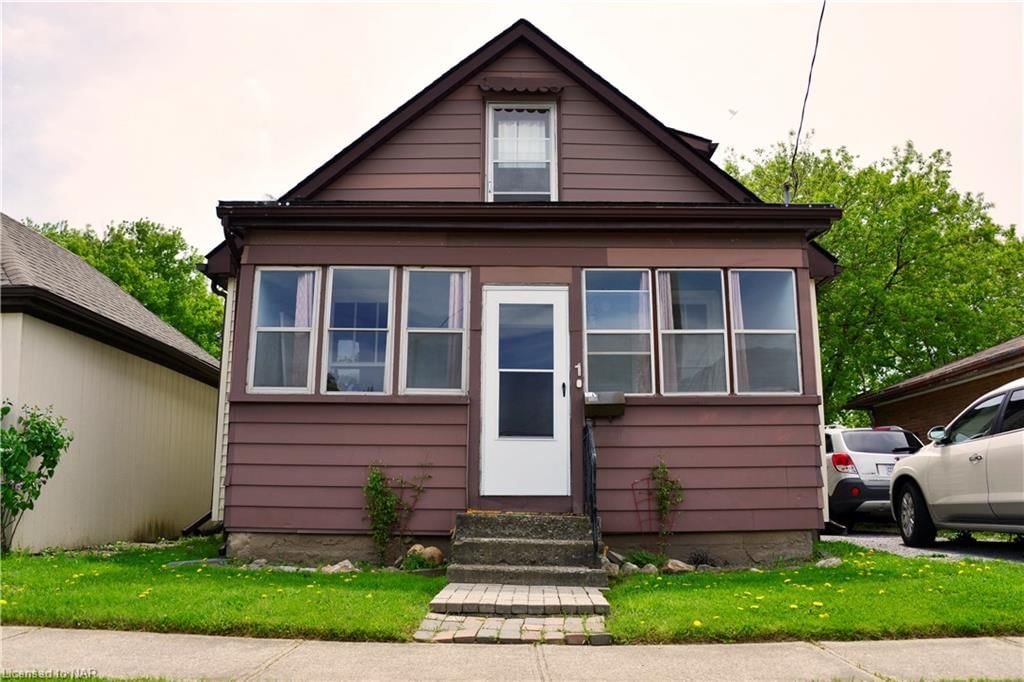
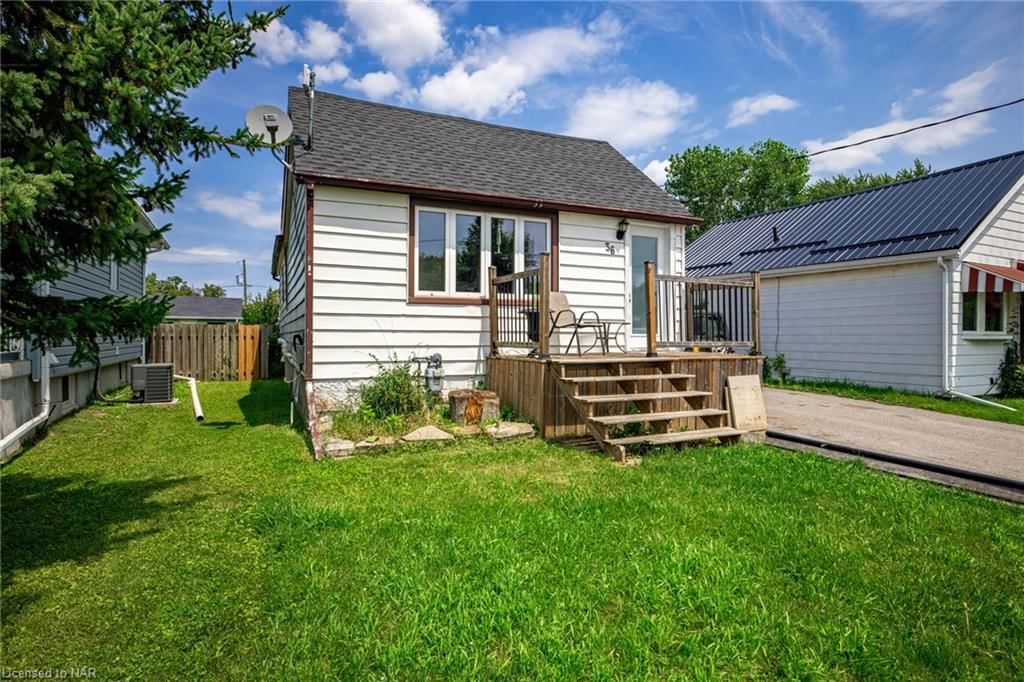
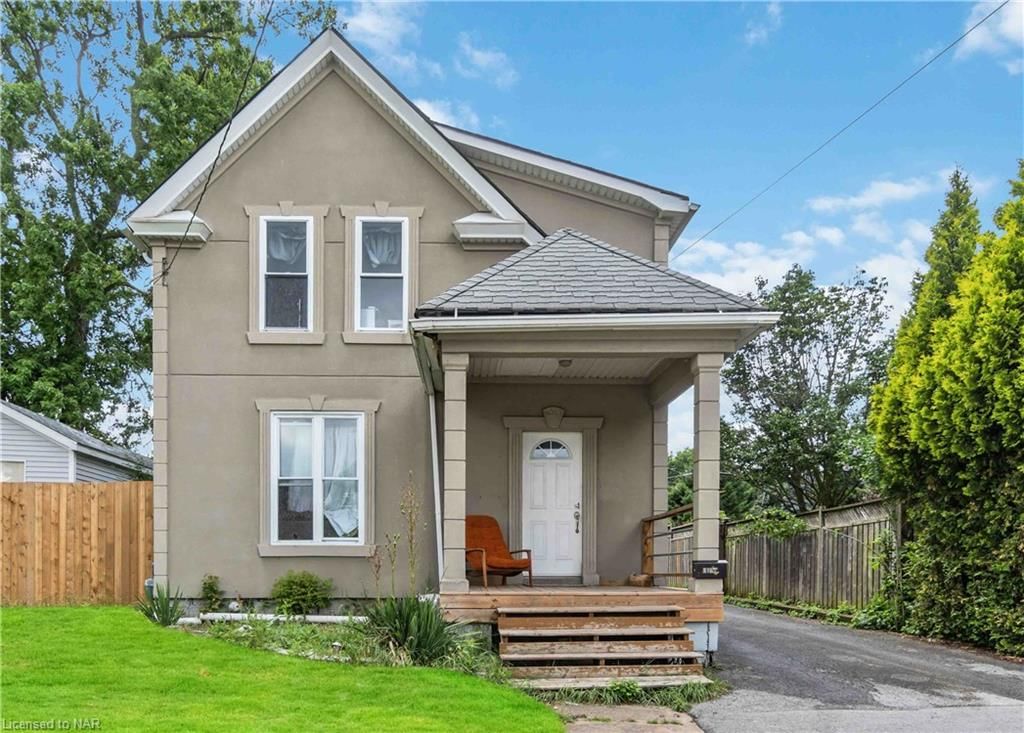
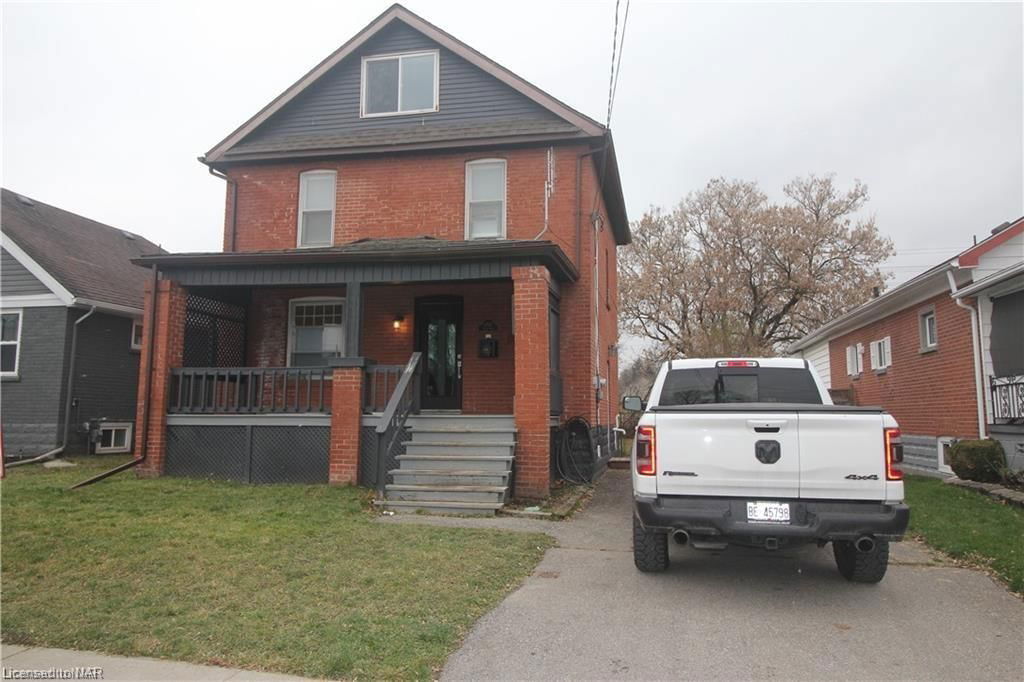
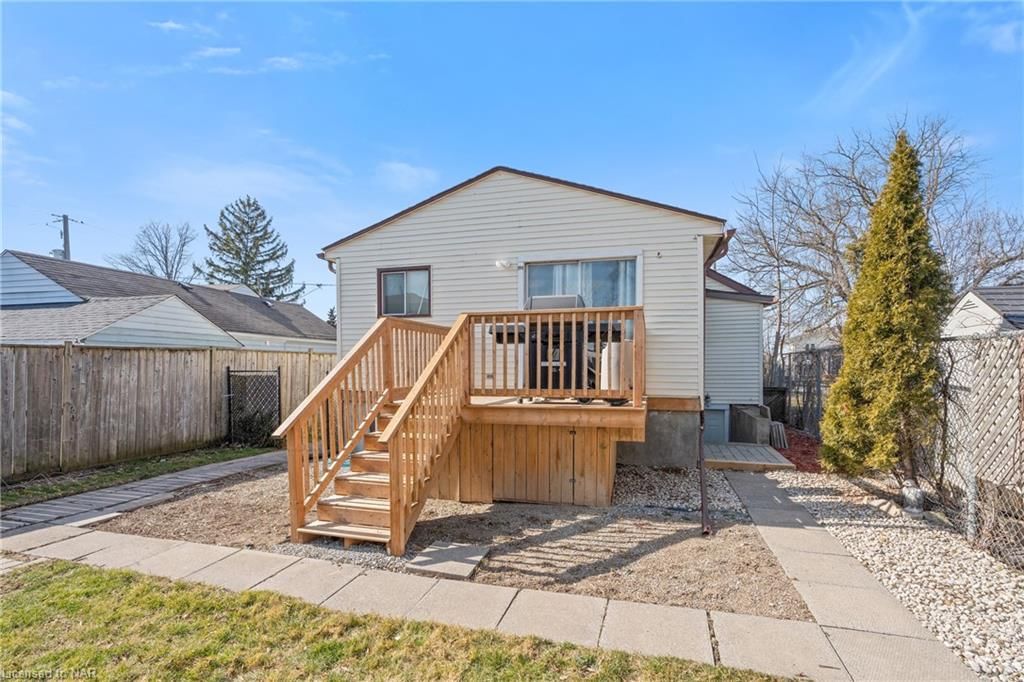
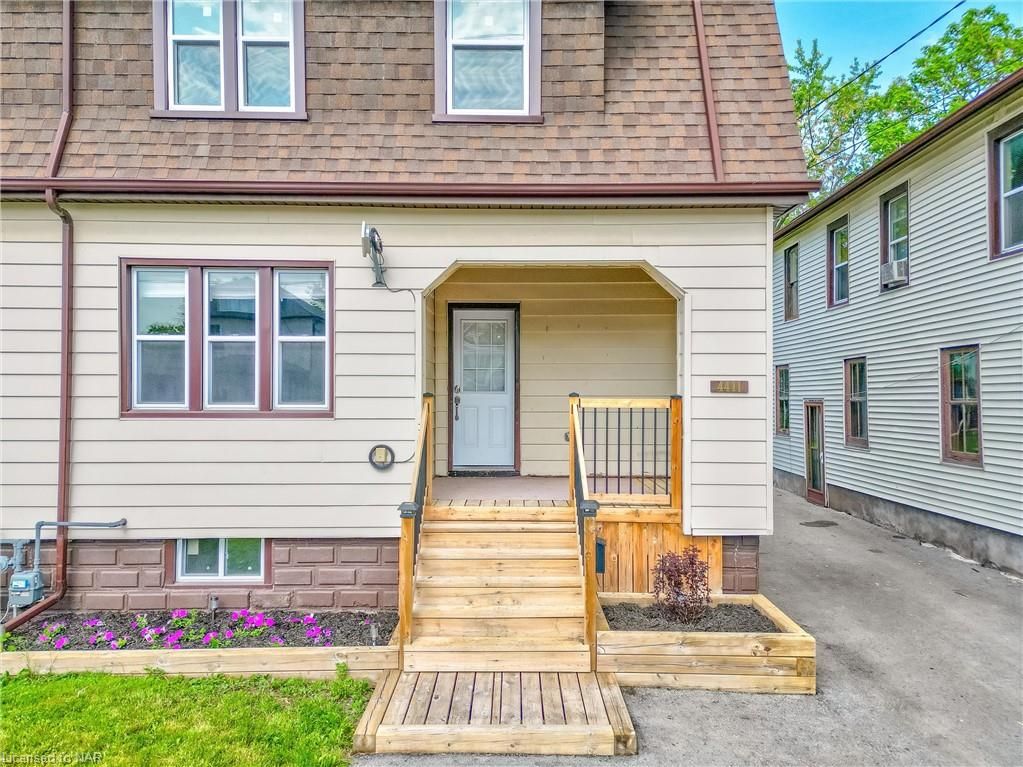
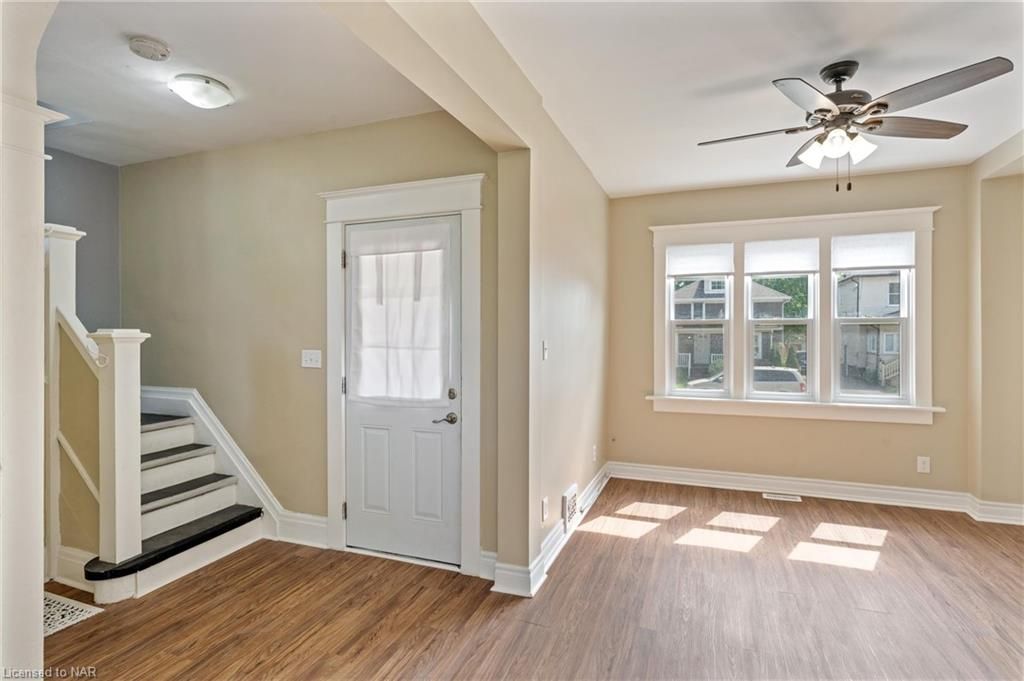
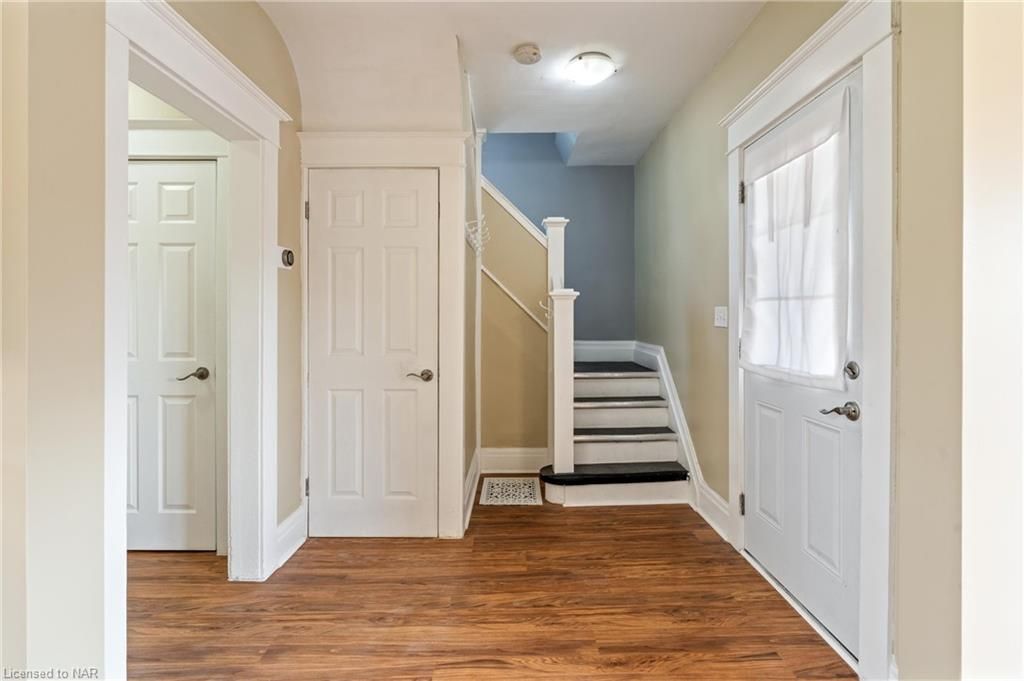
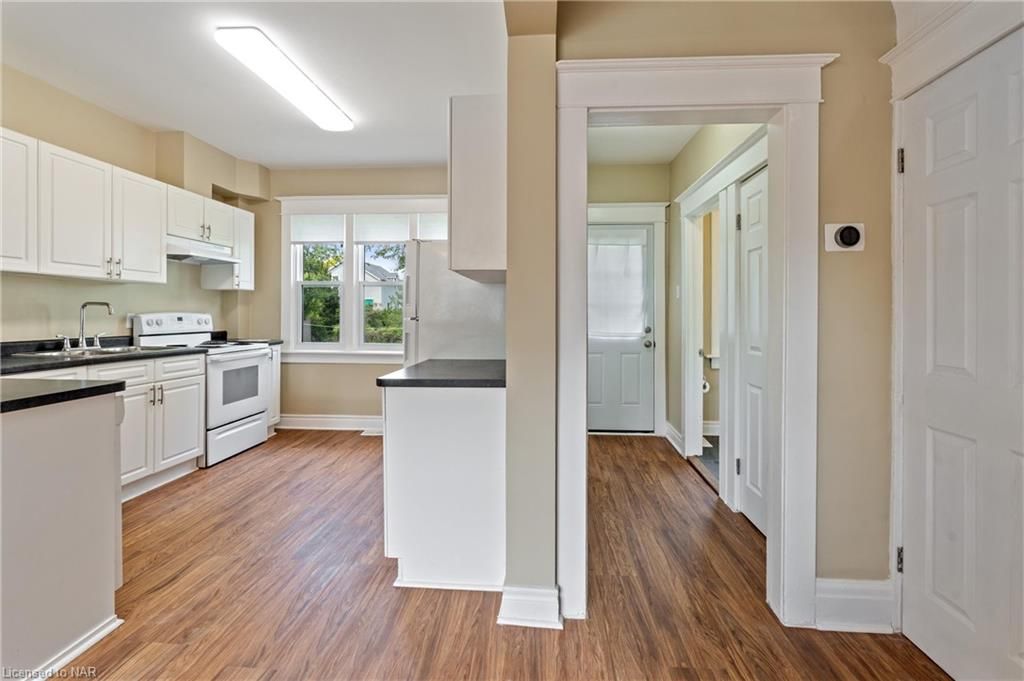
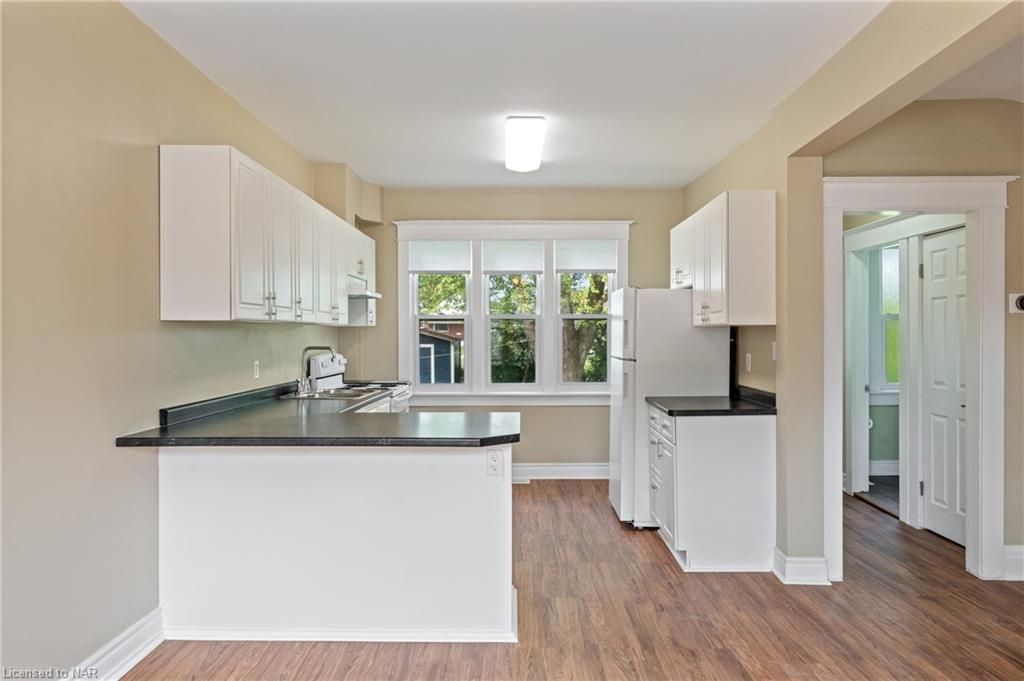
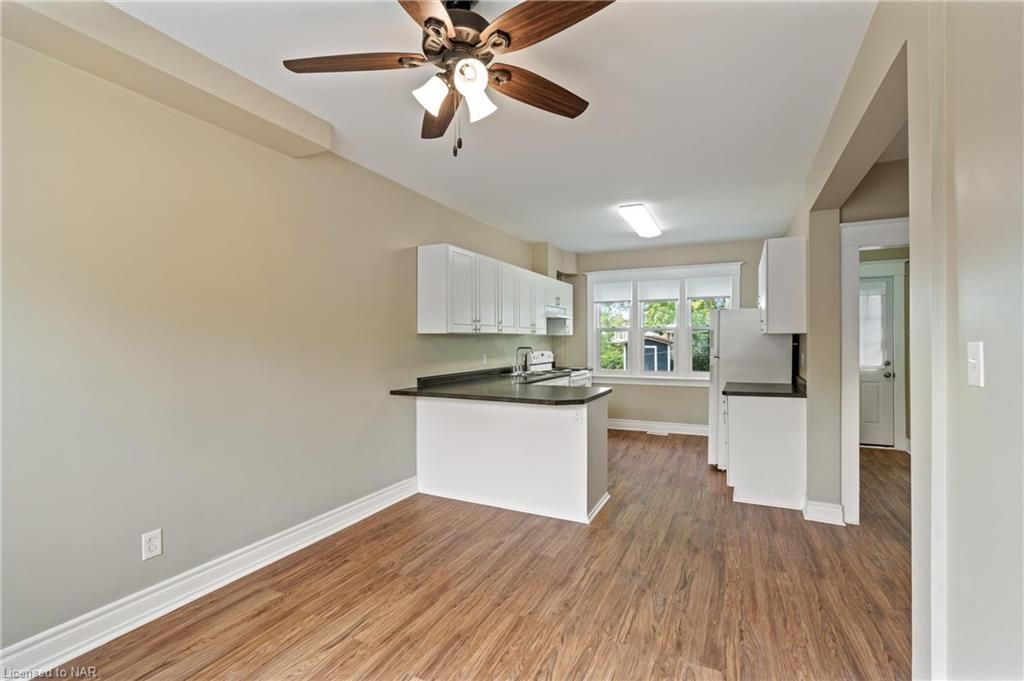
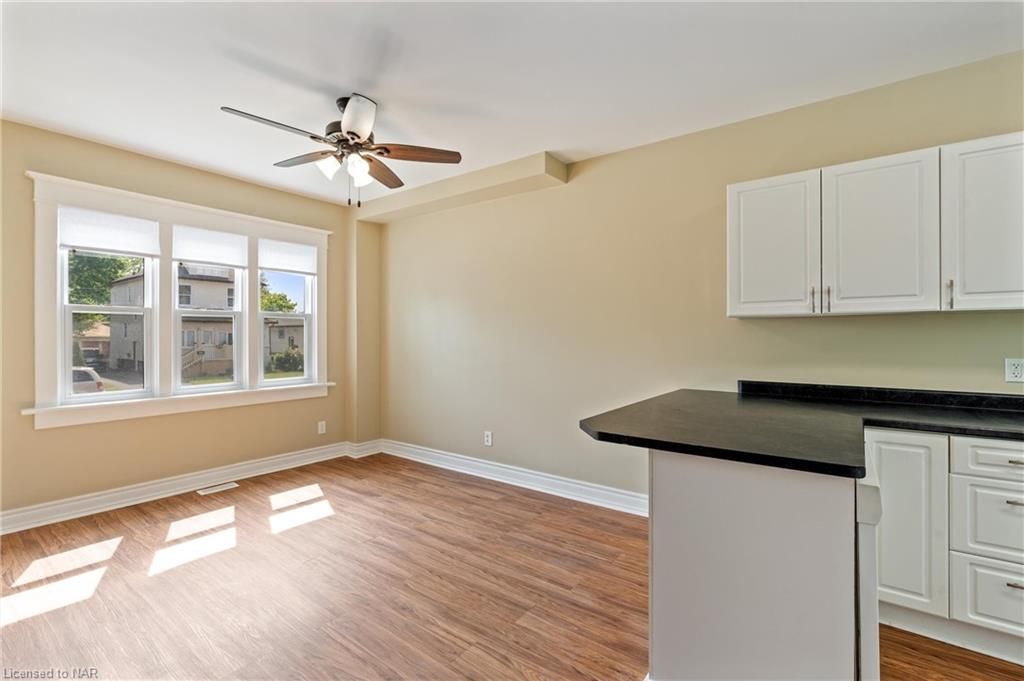
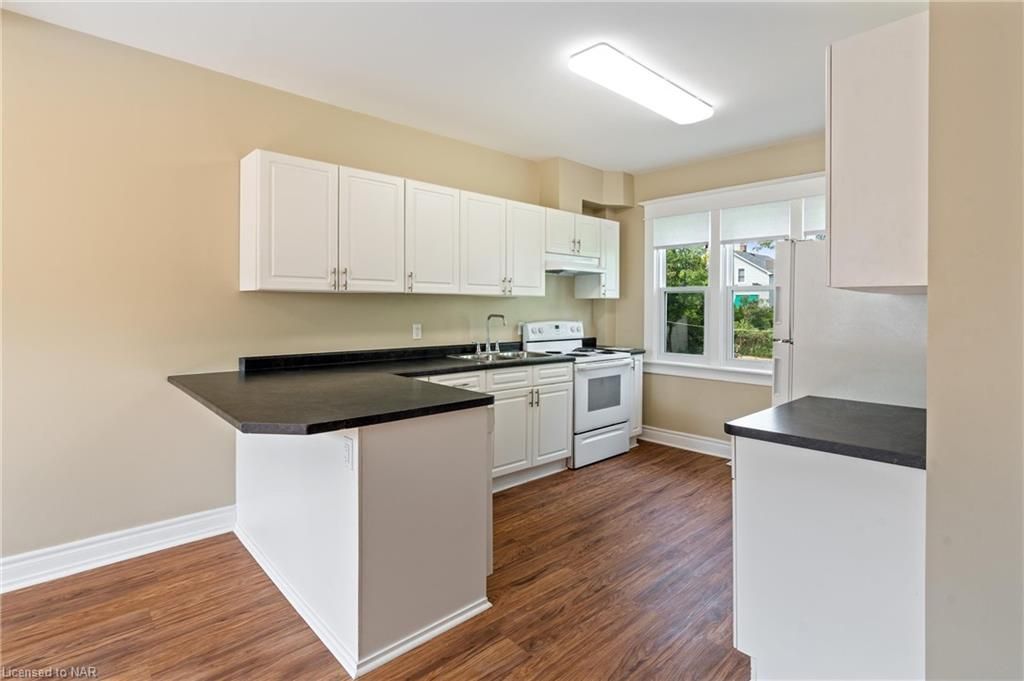
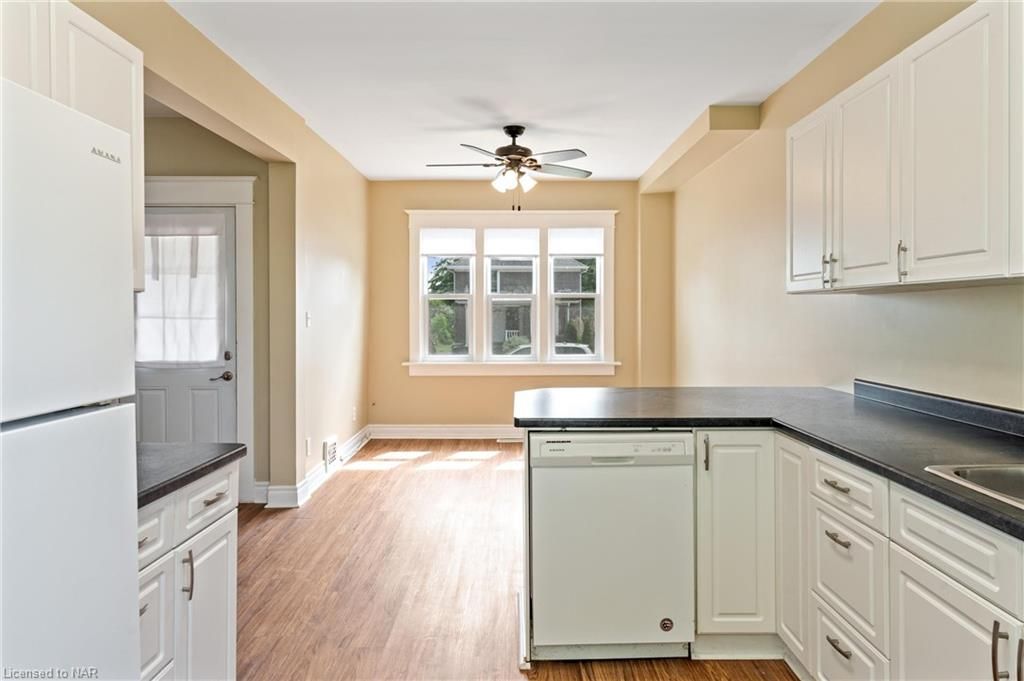
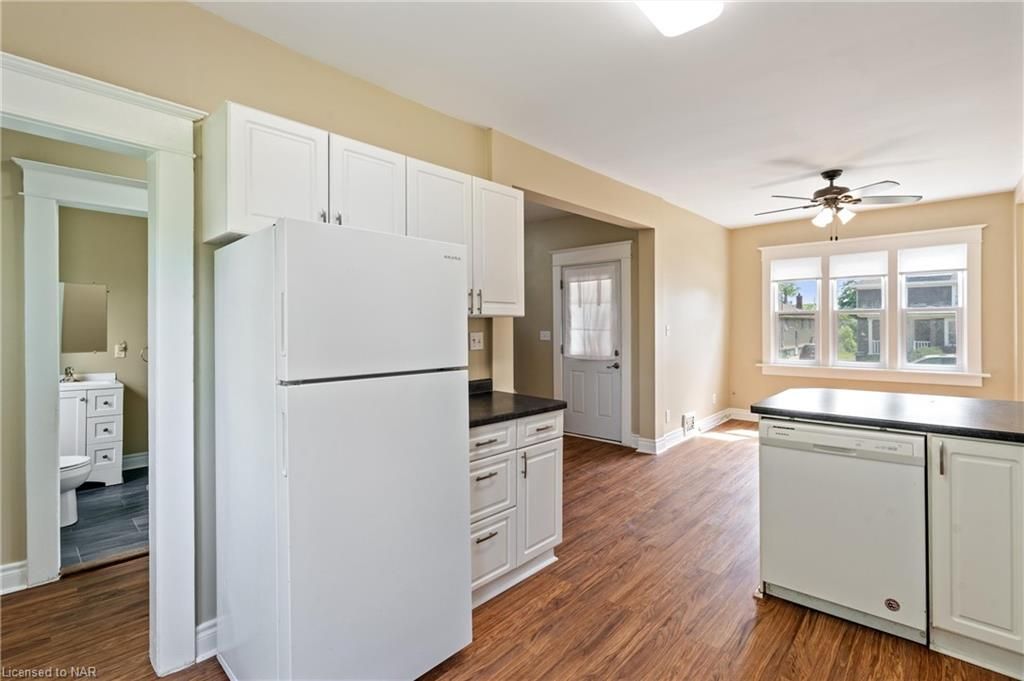
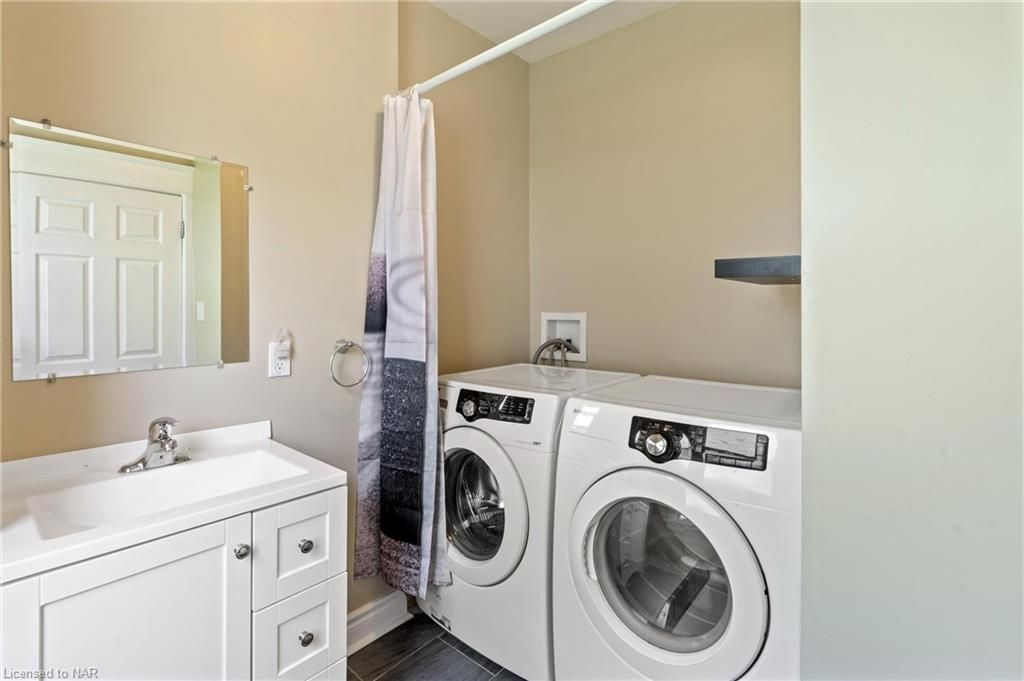
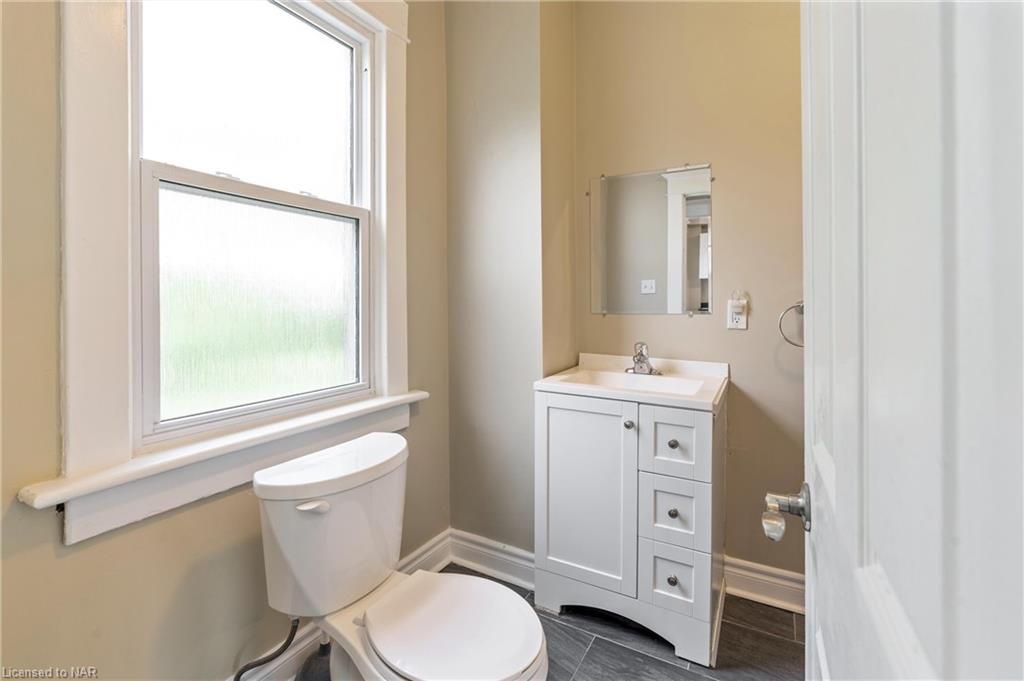
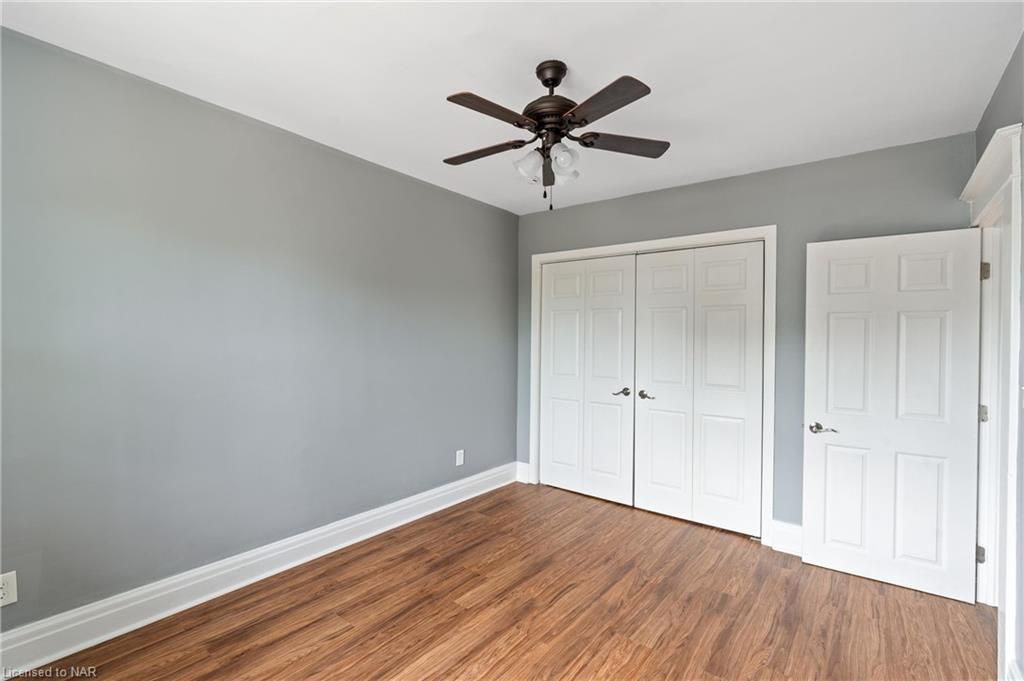
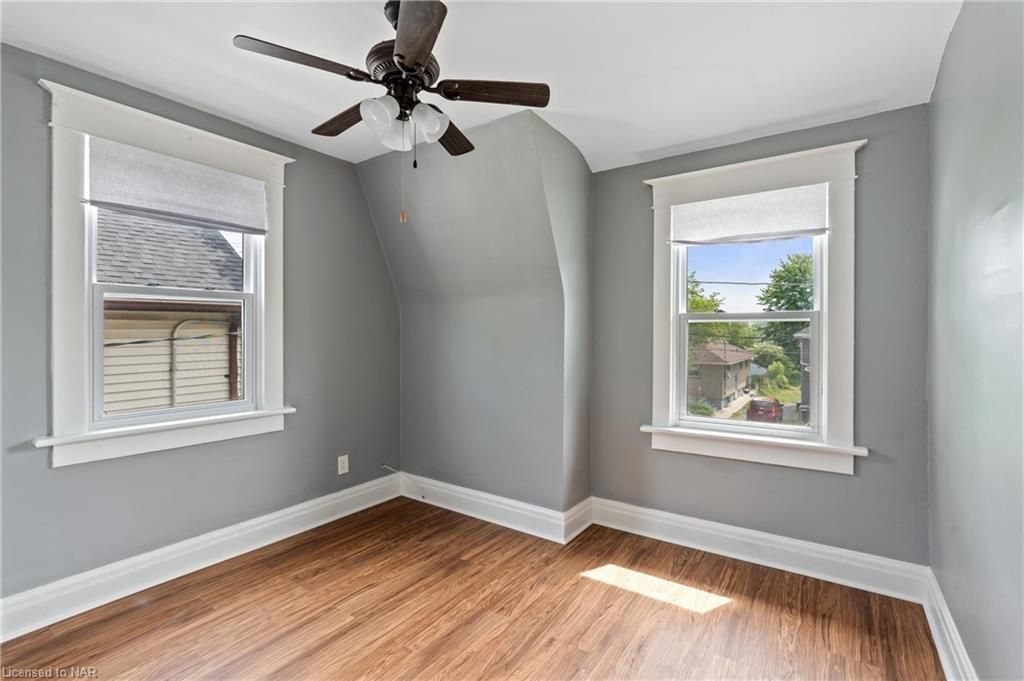
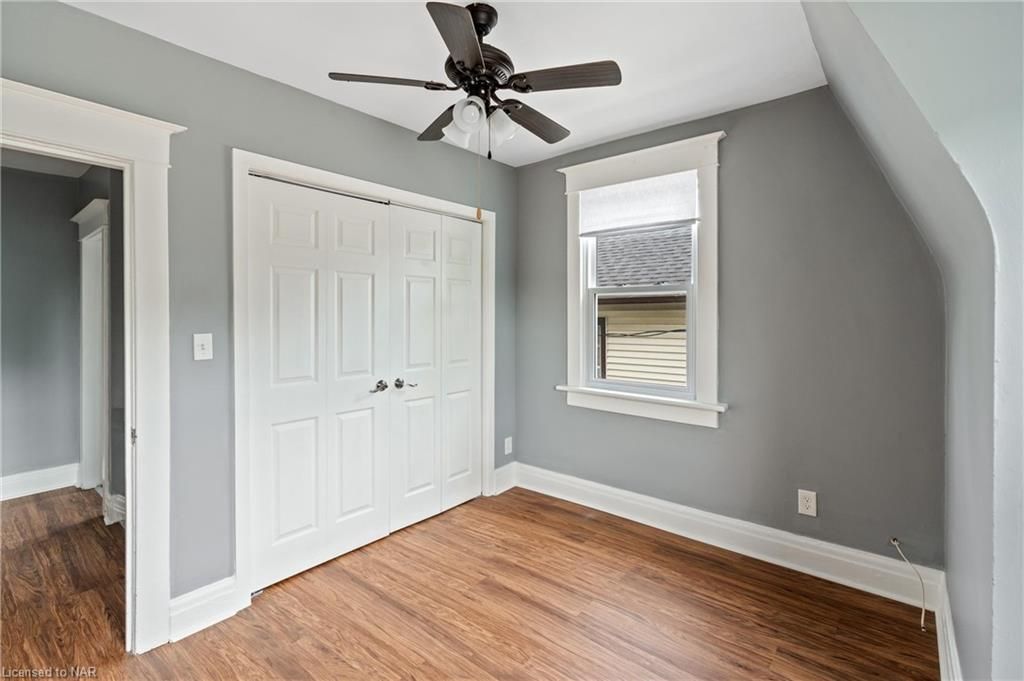
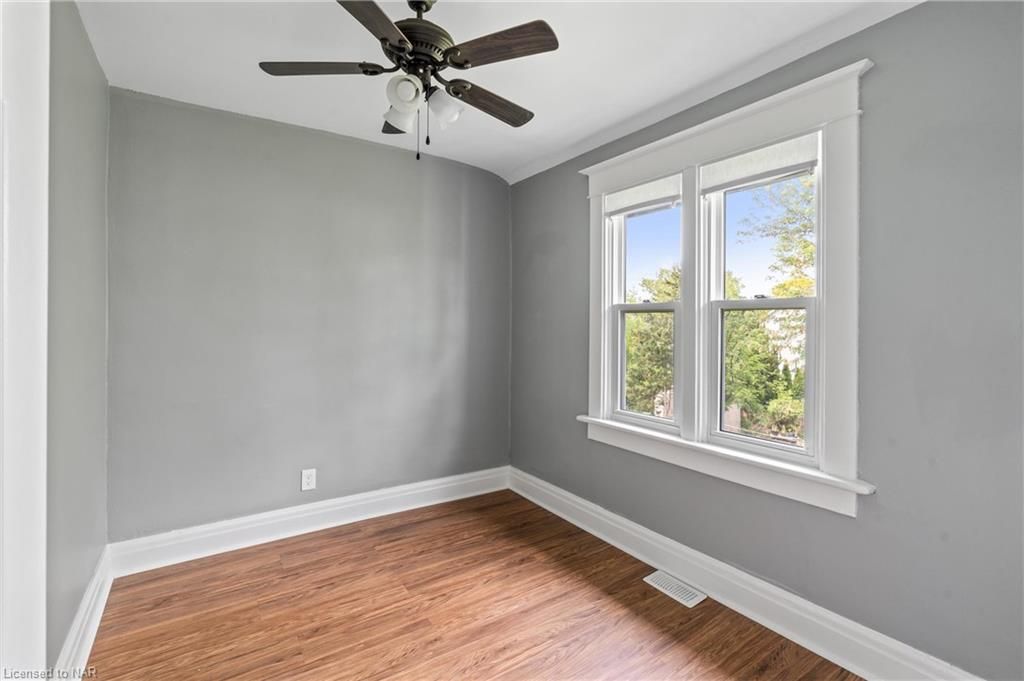
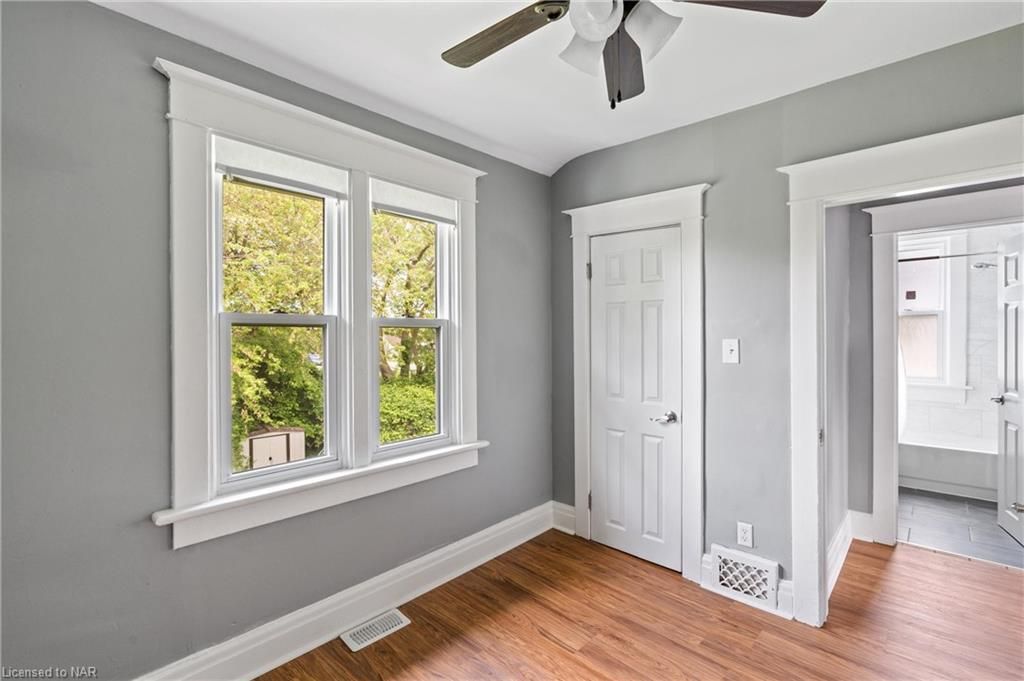
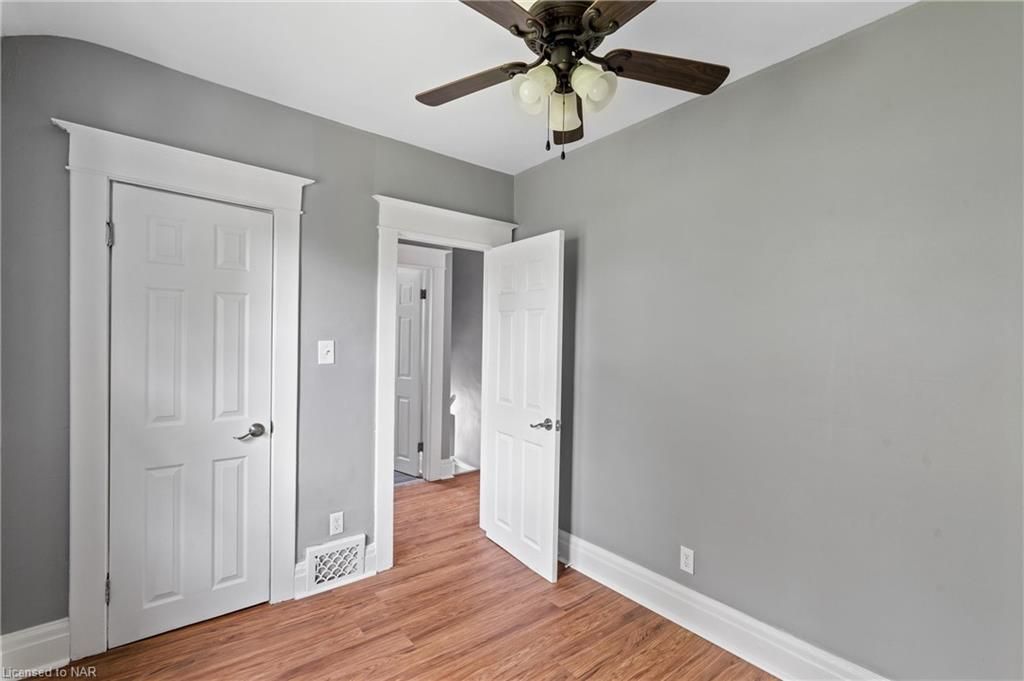
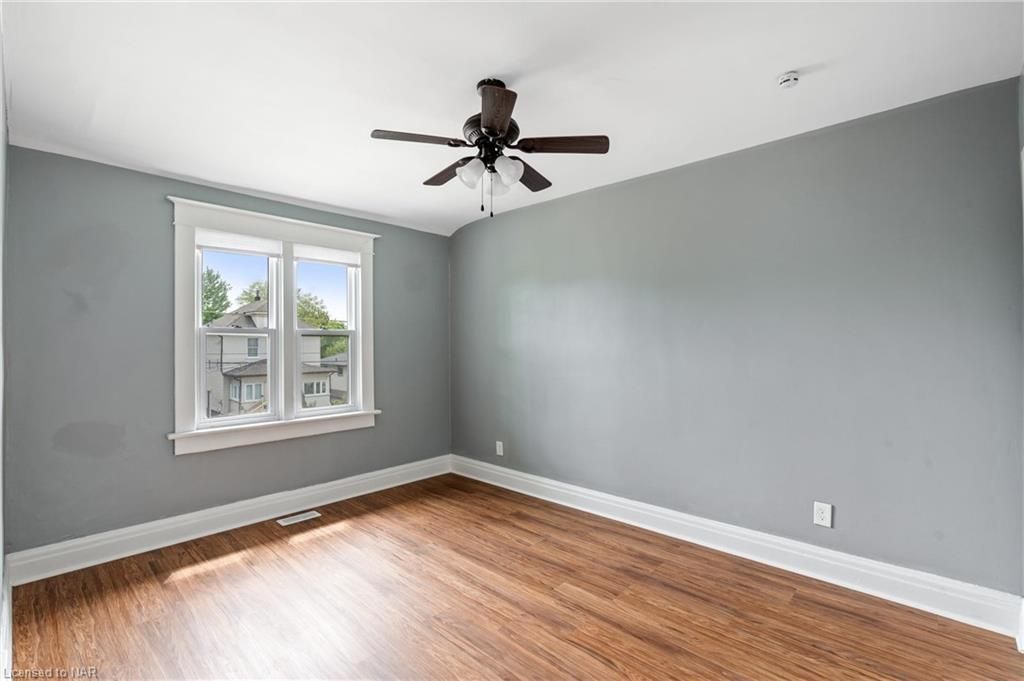
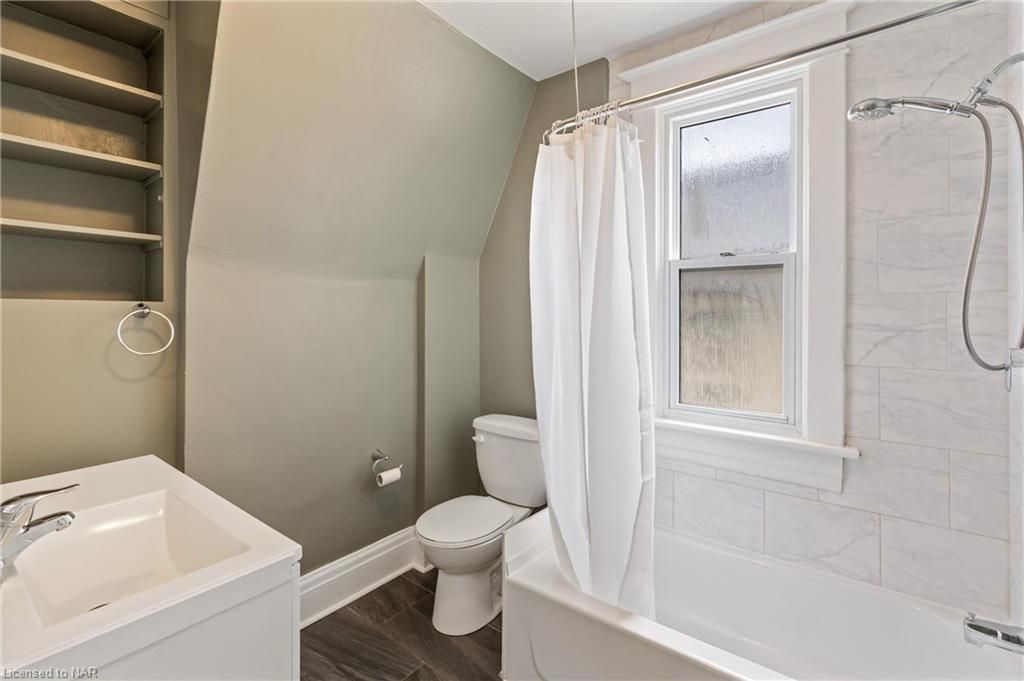
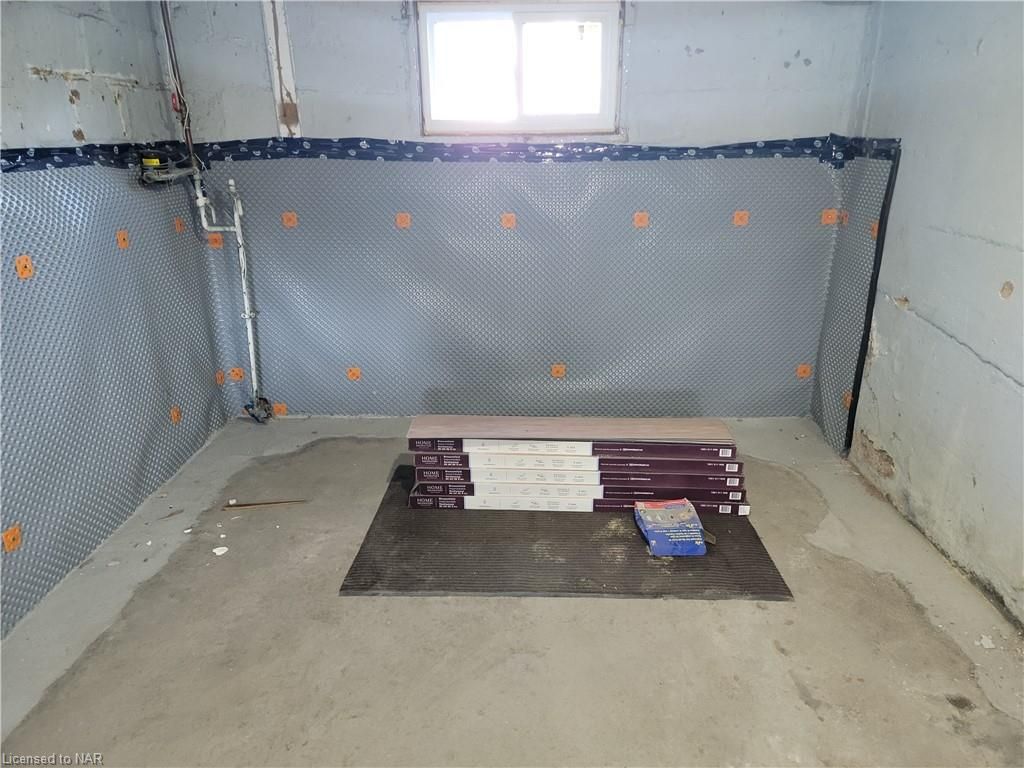
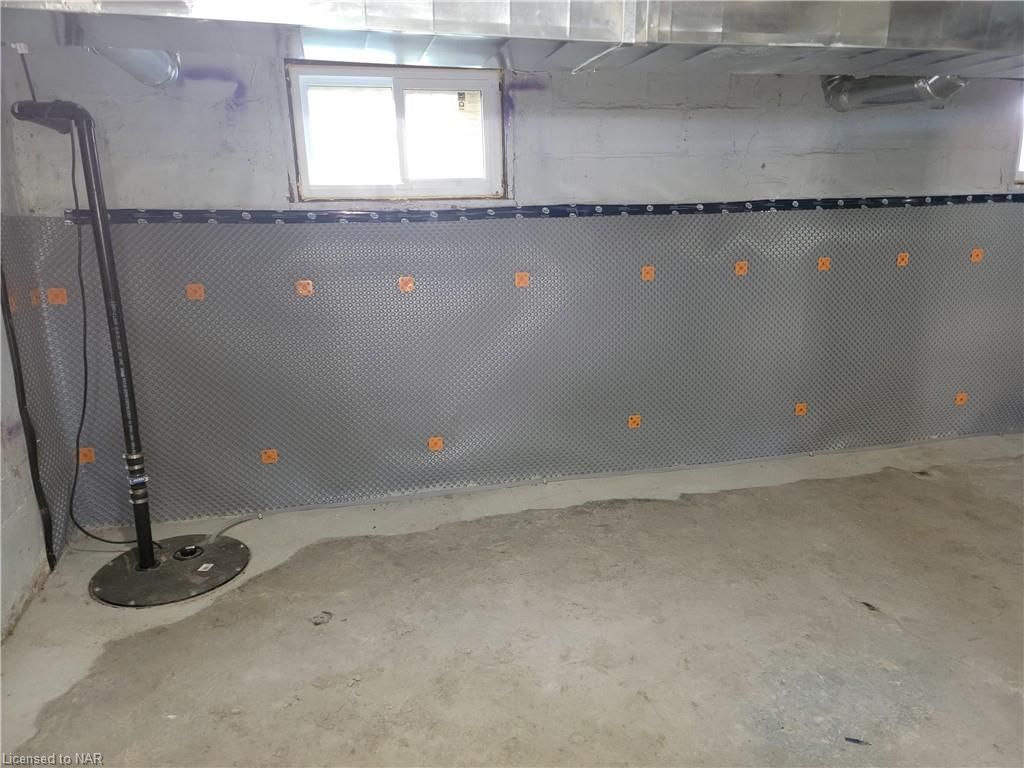
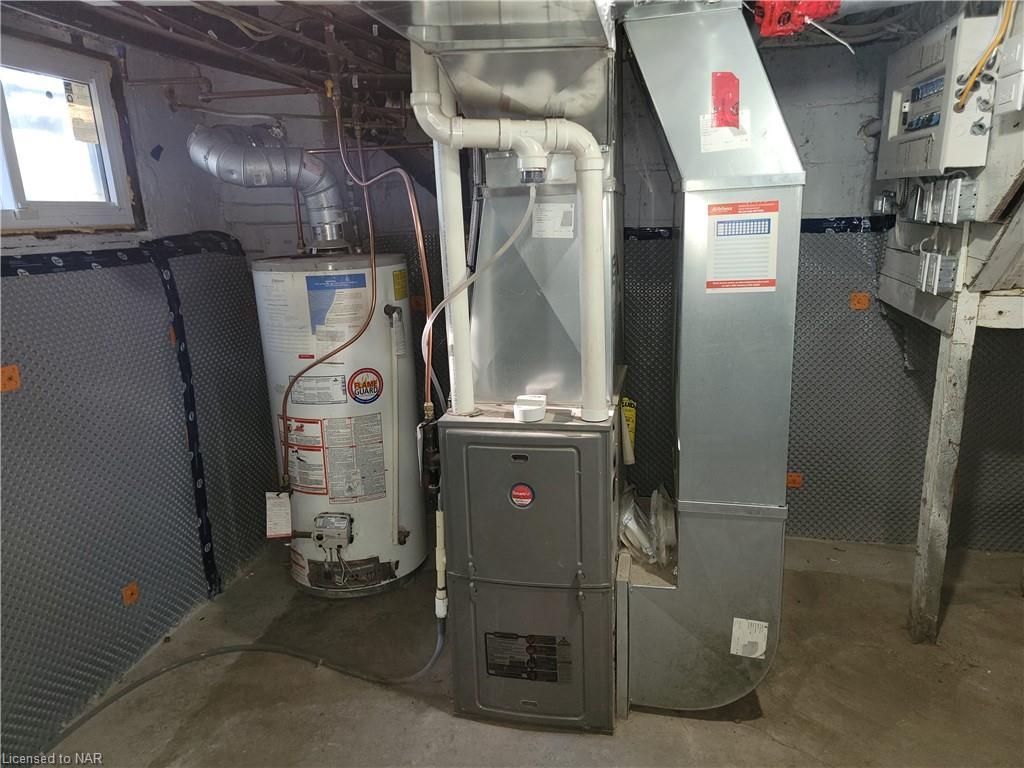
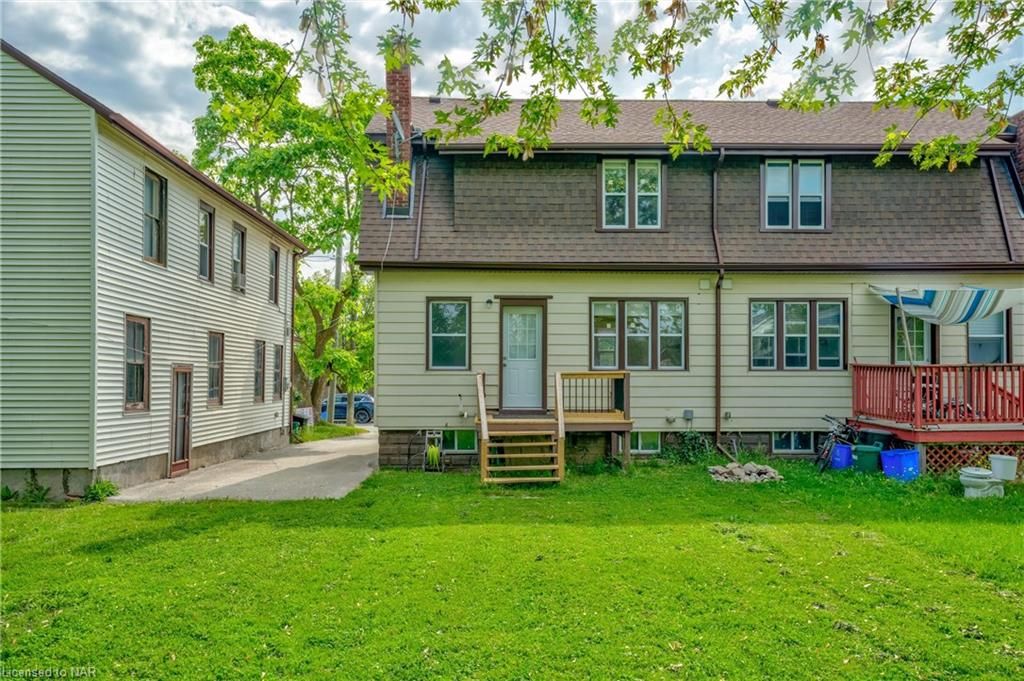
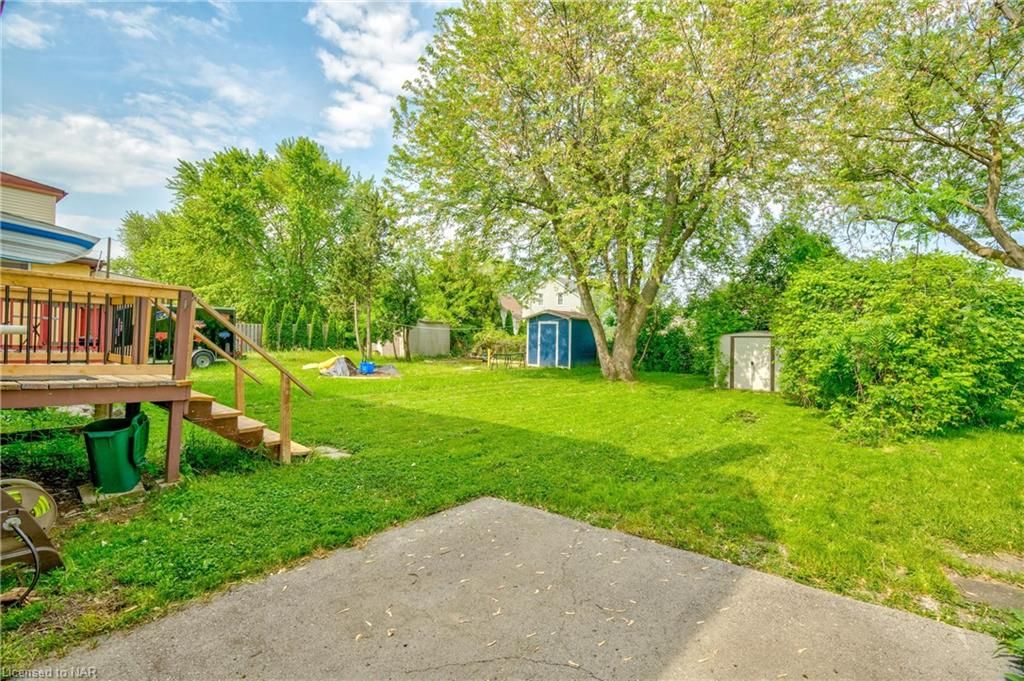
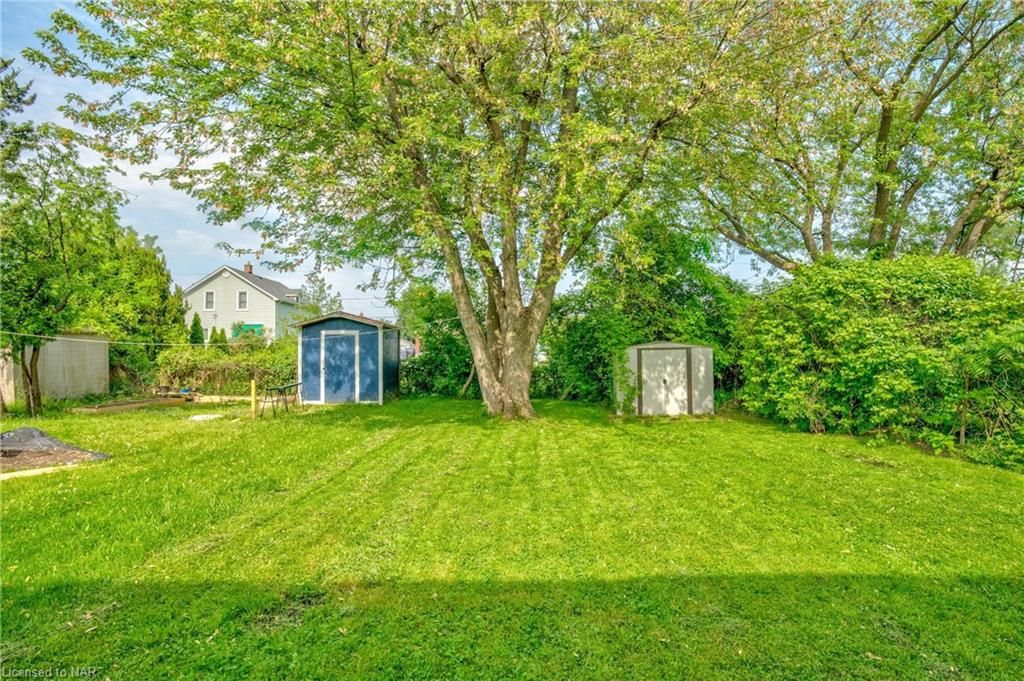
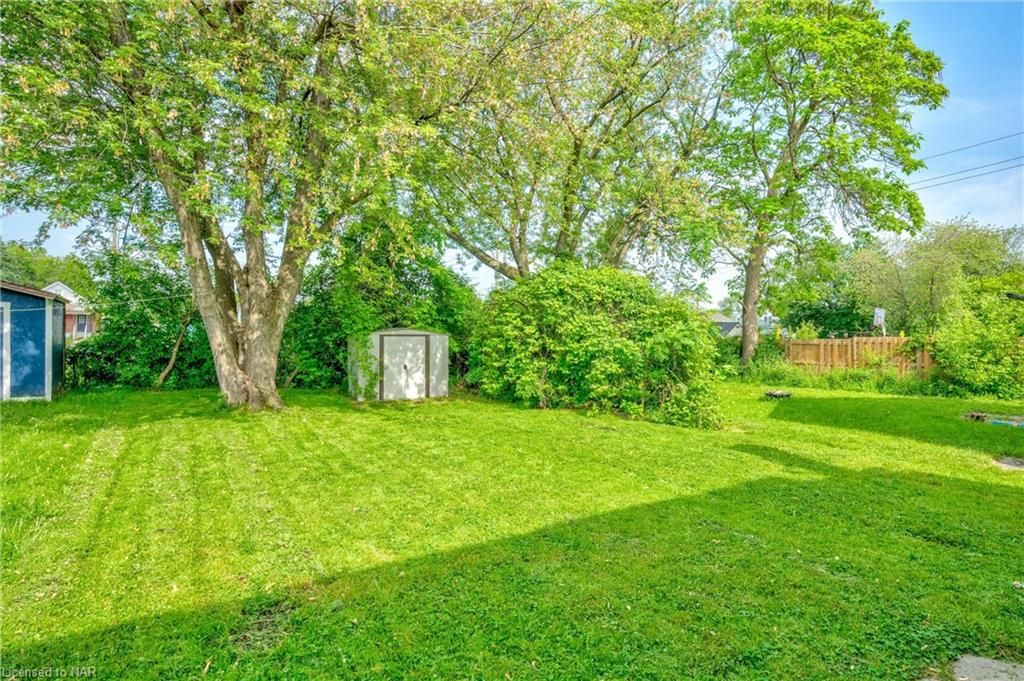
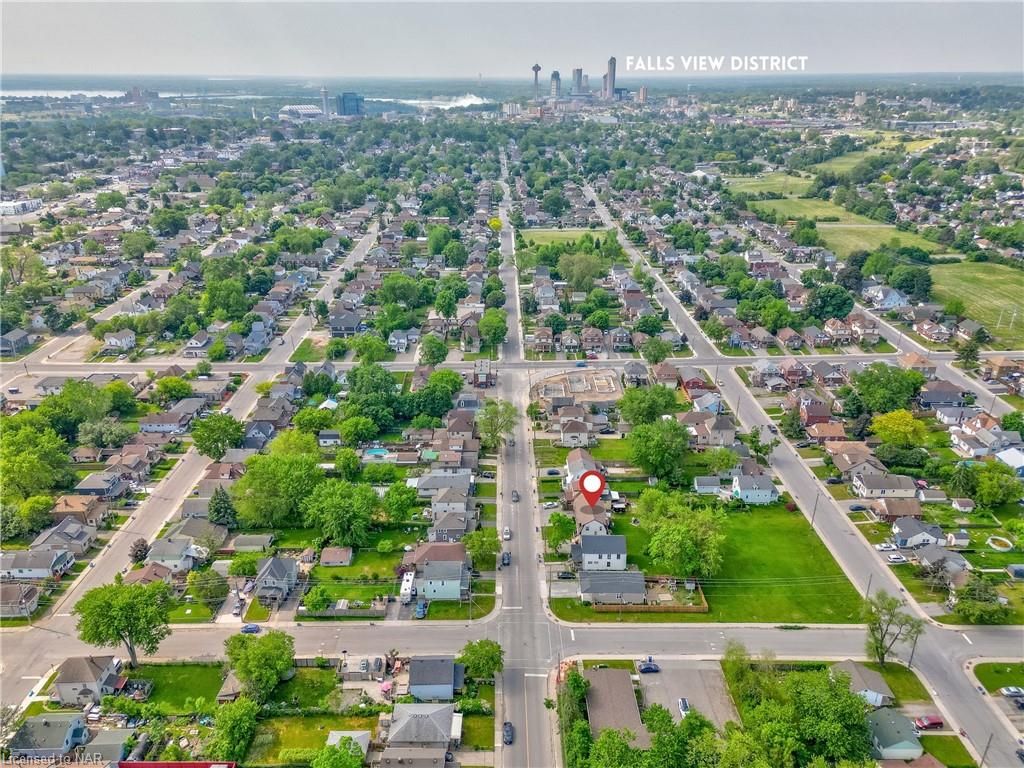
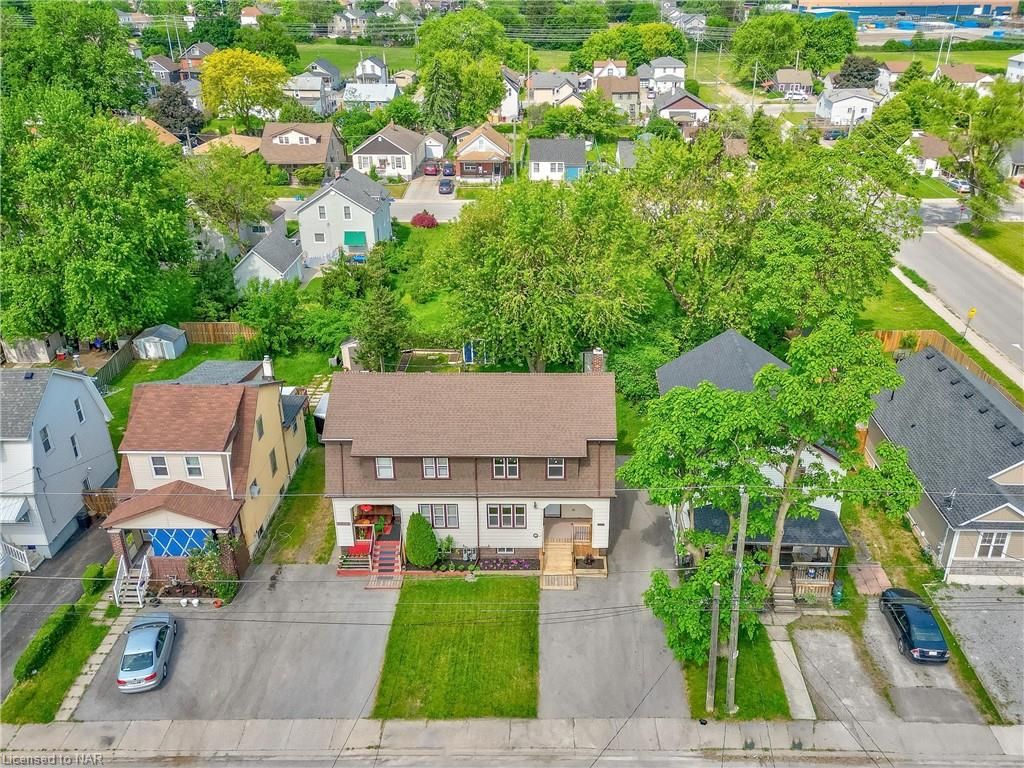
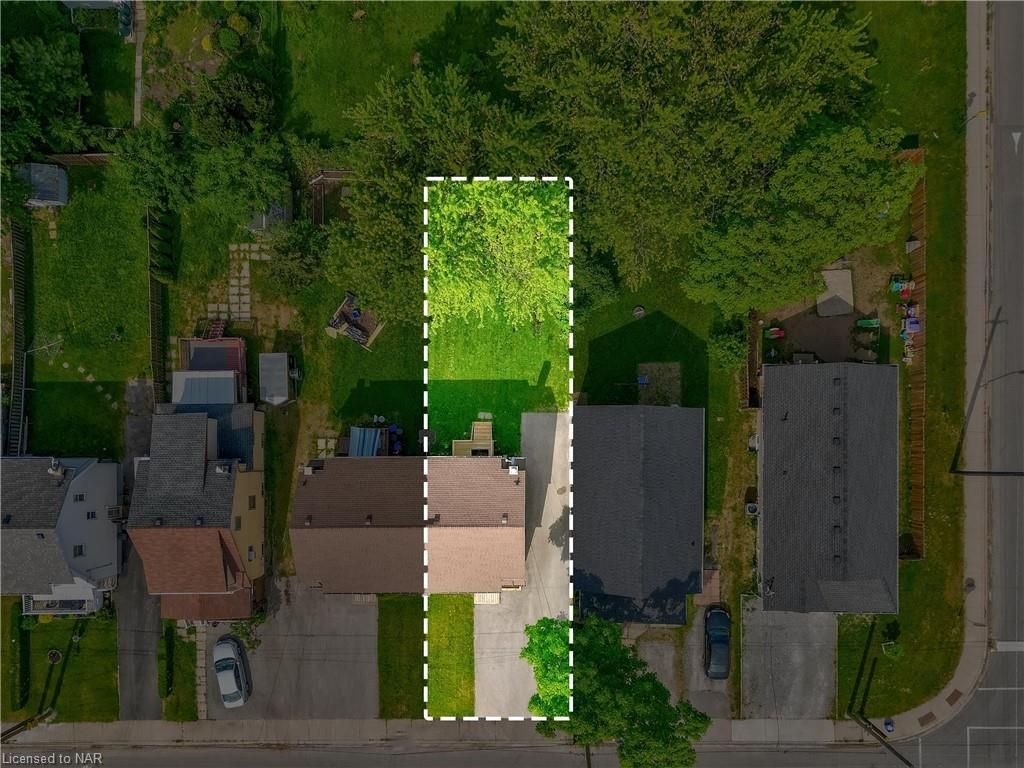
AFFORDABLE WITH TONS OF UPDATES! This 3 bedroom, 2 bathroom home has been almost completely renovated on both the main and upper floors. The main floor has an updated, open-concept kitchen and living room with vinyl plank flooring and an updated 2 piece bathroom with washer and dryer. The upper level has 3 bedrooms, each with vinyl plank flooring and a ceiling fan, two with larger closets and one with a small walk-in closet. The 4-piece bathroom has an updated vanity with cultured marble countertop, ceramic tile flooring and tub with ceramic shower tile. The basement is unfinished and was recently waterproofed (2022) with a new sump pump installed. A large backyard provides lots of room for kids or pets to play or to entertain guests outdoors. 100 amp service/breakers. Other updates include: Roof (2017), windows (2017), vinyl plank flooring on both floors (2021) driveway paving (2017) front porch (2017), kitchen (2017) appliances (2017 or newer), bathroom vanities and ceramic tile (2017), plumbing and electrical upgrades (2017). Conveniently located in close proximity to GO Station/bus terminal, QEW Highway access, bridge to the USA, Casino, Clifton Hill tourist attractions, the Niagara Gorge Hiking Trail and the Horseshoe and American Falls which are ALL WITHIN A 5 MINUTE DRIVE!
Dishwasher,Dryer,Refrigerator,Stove,Washer
Copyright 2025 Information Technology Systems Ontario, Inc. The information provided herein must only be used by consumers that have a bona fide interest in the purchase, sale, or lease of real estate and may not be used for any commercial purpose or any other purpose.
Eat-in Kitchen
Bedroom Primary
Bedroom
Living Room
Bedroom
The graph below compares the average list price and average sale price of homes in this neighborhood by month for the last 24 months. When average sale price is greater than average list price, this may suggest a buyer's market. When average sale price is lower than the average list price this may suggest a seller's market.
The graph below illustrates the average days on market for homes in this neighborhood. The yellow area may indicate a buyer's market, the green area may indicate a balanced market and the red area may indicate a seller's market.
Sales Representative, Century 21 People’s Choice Realty Inc., Brokerage
(647) 576 - 2100